Uncertainty
This resource is to help distinguish between concepts of uncertainty (e.g., see page 109 in Statistical Rethinking). But note, the table below is an oversimplification for learning purposes. There may be additional subtle nuances not captured in the categorization. I encourage the curious reader to check out some of the references below.
| Uncertainty in parameters | Uncertainty in sampling |
|---|---|
| Epistemic | Aleatoric |
| Missing knowledge | Statistical |
| Reducible | Irreducible |
| Due to ignorance and can be reduced with new information | Variability in the outcome due to inherently random effects (non-deterministic) |
| more Bayesian-like | more Frequentist-like |
| Compatibility (credible) intervals of the posterior mean | Posterior predictive distribution |
rethinking link function | rethinking sim function |
| “Less common for ML models to consider epistemic; if they do, usually through probabilistic (Bayesian) components” (Bhatt et al., 2021) | “most ML models account for aleatoric uncertainty through the specification of a noise model or likelihood function” (Bhatt et al., 2021) |
Experiment
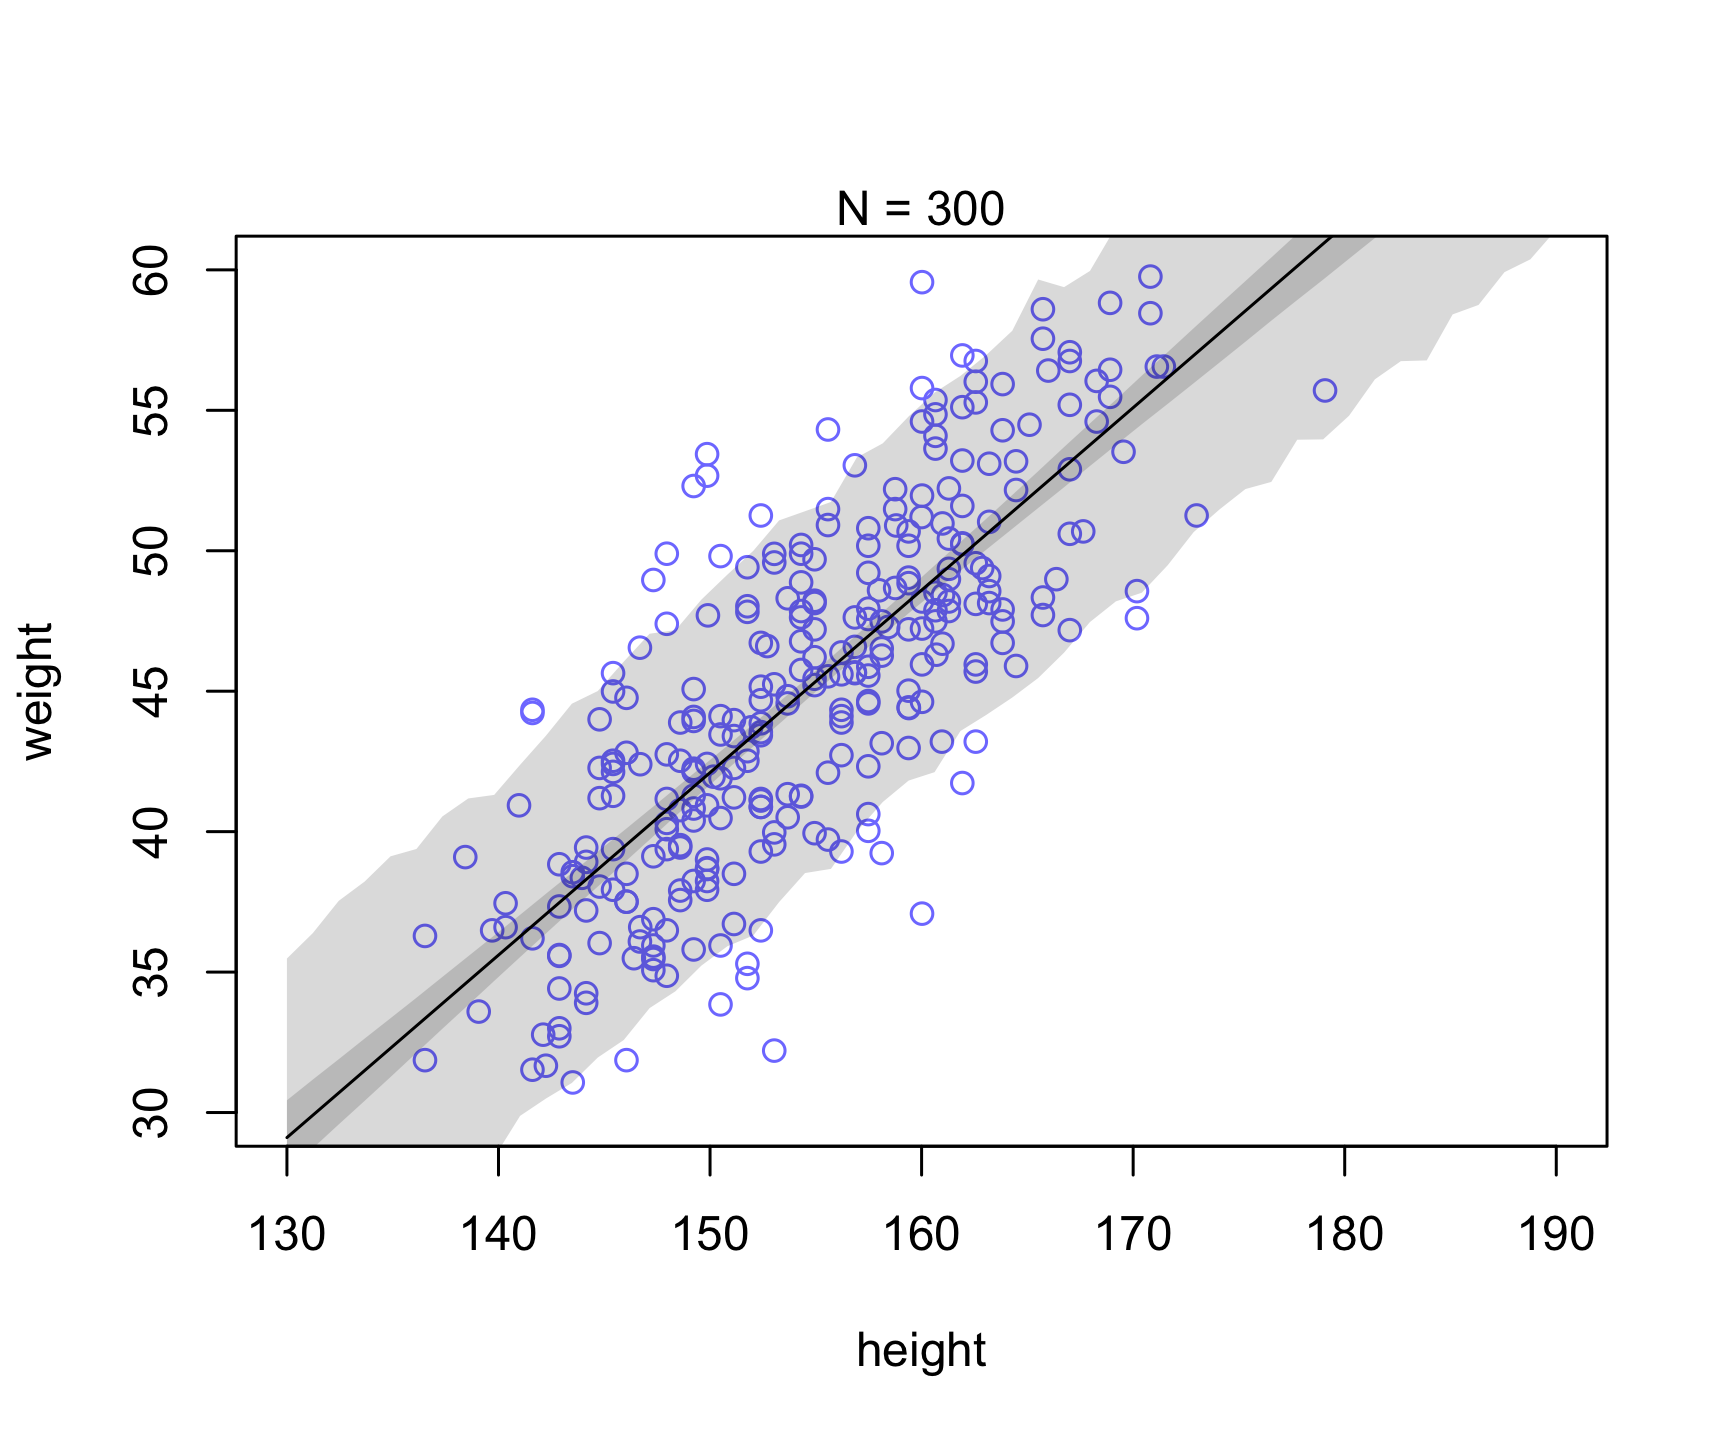
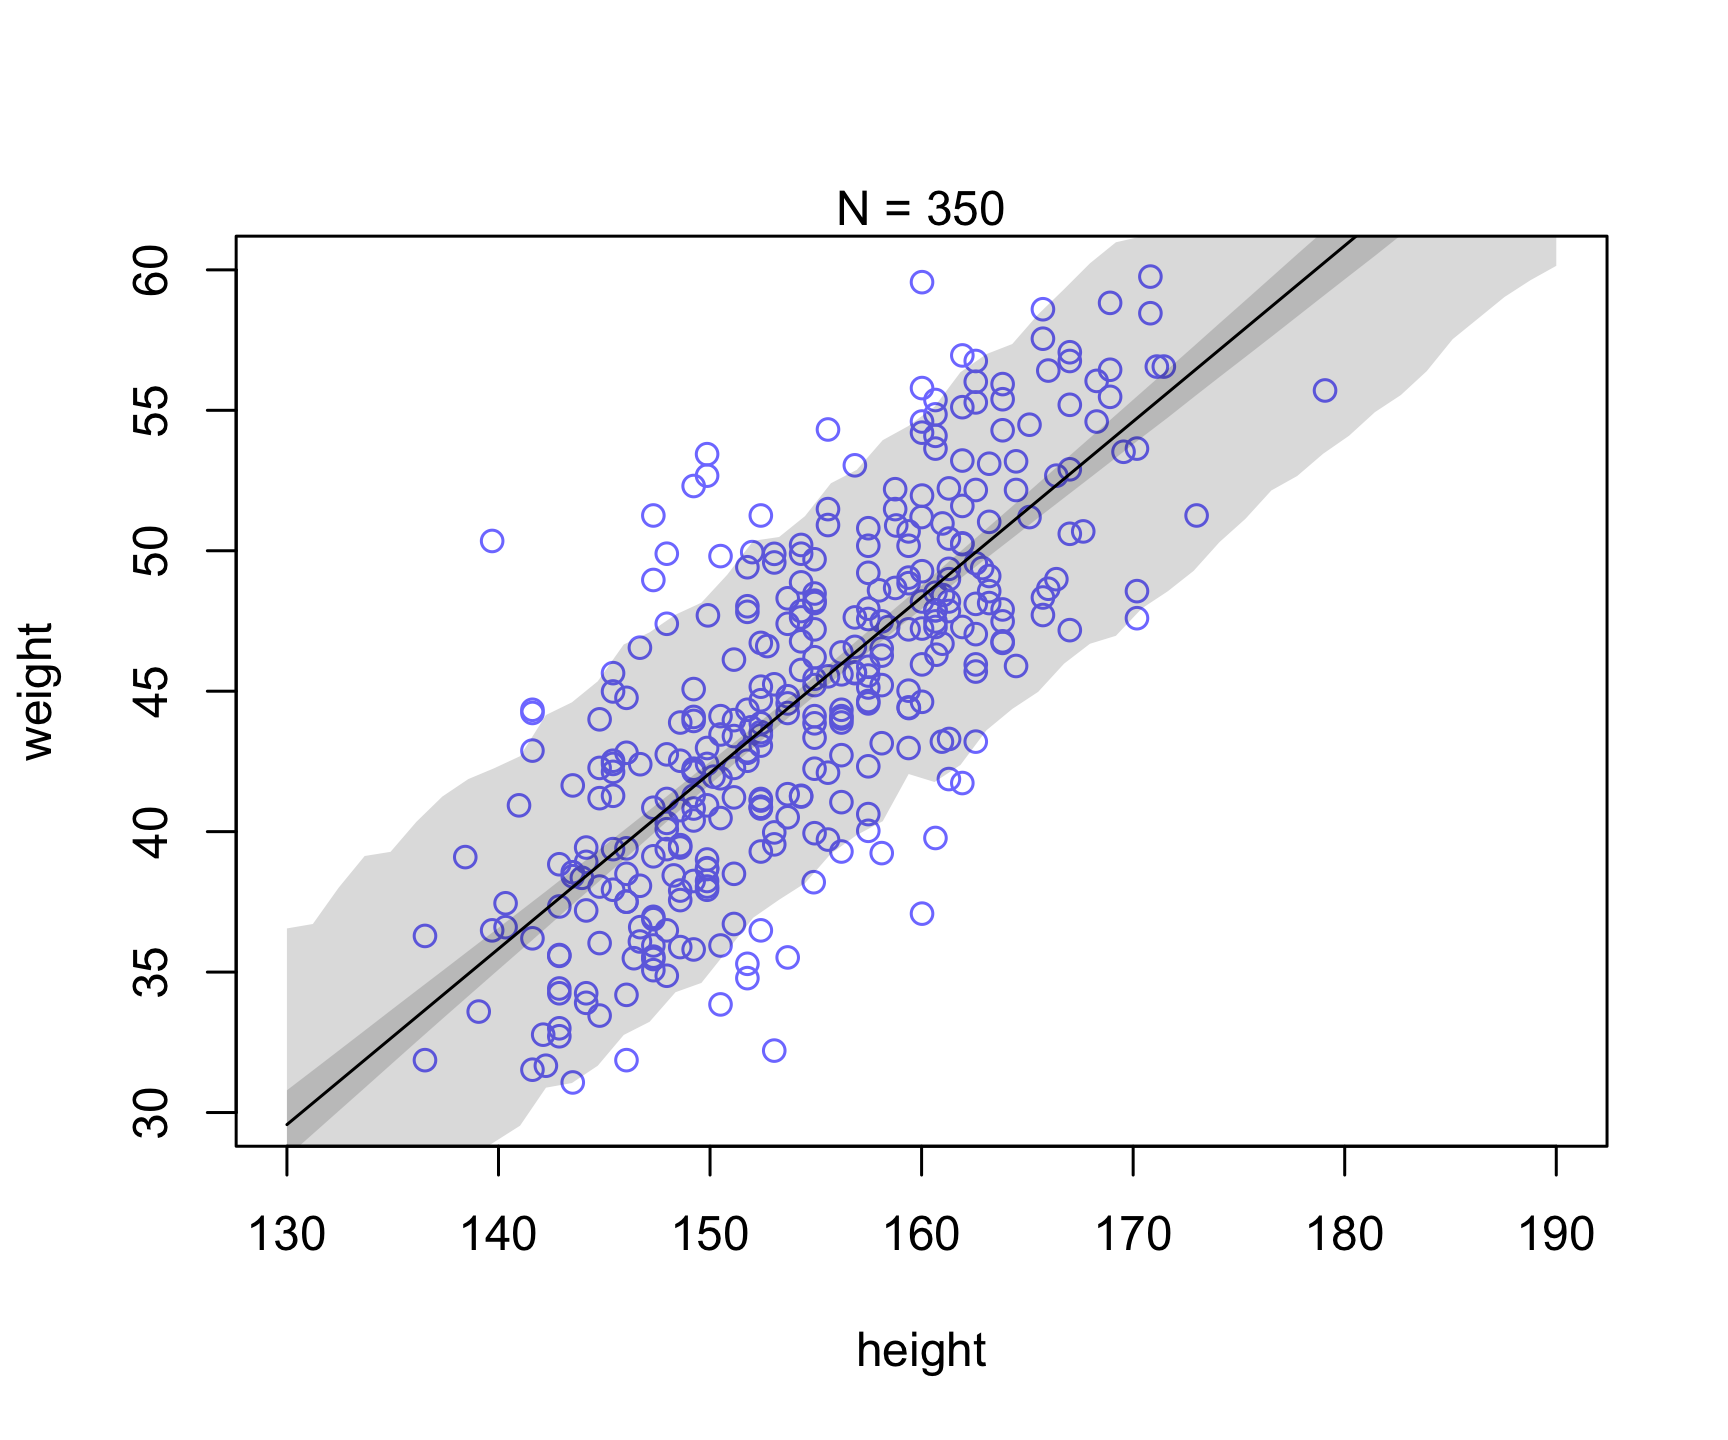
Let’s take a similar example as in Chapter 4 (Figure 4.7). Let’s see what happens to the uncertainty when we increase sample size (i.e., see reducible vs irreducible).
Which of the uncertainty (posterior for mu prediction or individual prediction) appears to be reducible vs. irreducible?
library(rethinking)
data(Howell1)
d <- Howell1
d2 <- d[ d$age >= 18 , ]

set.seed(123)

runSimulation <- function(N){
  dN <- d2[ 1:N , ]
  dN$mean_height = mean(dN$height)

  mN <- quap(
      alist(
          weight ~ dnorm( mu , sigma ) ,
          mu <- a + b*( height - mean_height),
          a ~ dnorm( 60 , 10 ) ,
          b ~ dlnorm( 0 , 1 ) ,
          sigma ~ dunif( 0 , 10 )
      ) , data=dN )

  xseq <- seq(from=130,to=190,len=50)

  # epistemic-like uncertainty -- reducible
  mu <- link(mN,data=list( height=xseq, mean_height = mean(dN$height)))
  mu.mean <- apply( mu , 2 , mean )
  mu.PI <- apply( mu , 2 , PI , prob=0.89 )

  # aleatoric-like uncertainty -- irreducible
  sim.height <- sim( mN , data=list(height=xseq,mean_height = mean(dN$height)))
  height.PI <- apply( sim.height , 2 , PI , prob=0.89 )

  plot( dN$height , dN$weight ,
      ylim=c(30,60) , xlim=c(130,190) ,
      col=rangi2 , xlab="height" , ylab="weight" )
  mtext(concat("N = ",N))
  lines( xseq , mu.mean )
  shade( mu.PI , xseq )
  shade( height.PI , xseq )
}
Use purrr::map to run under different parameters.
runs <- c(10, 25, 50, 100, 150, 200, 250, 300, 350)

purrr::walk(runs, runSimulation)


References
Bhatt, Umang, Javier Antorán, Yunfeng Zhang, Q Vera Liao, Prasanna Sattigeri, Riccardo Fogliato, Gabrielle Melançon, et al. 2021. “Uncertainty as a Form of Transparency: Measuring, Communicating, and Using Uncertainty.” In Proceedings of the 2021 AAAI/ACM Conference on AI, Ethics, and Society, 401–13.
Hüllermeier, Eyke, and Willem Waegeman. 2021. “Aleatoric and Epistemic Uncertainty in Machine Learning: An Introduction to Concepts and Methods.” Machine Learning 110 (3): 457–506.
Kendall, Alex, and Yarin Gal. 2017. “What Uncertainties Do We Need in Bayesian Deep Learning for Computer Vision?” Advances in Neural Information Processing Systems 30.
Senge, Robin, Stefan Bösner, Krzysztof Dembczyński, Jörg Haasenritter, Oliver Hirsch, Norbert Donner-Banzhoff, and Eyke Hüllermeier. 2014. “Reliable Classification: Learning Classifiers That Distinguish Aleatoric and Epistemic Uncertainty.” Information Sciences 255: 16–29.